
Annual Letter to Investors: 2025-2026
“The eye sees only what the mind is prepared to comprehend.”
Robertson Davies
It took oil going to $120 a barrel to shift the news cycle from AI. We have completed only one quarter of CY2026, but like last year, it already feels like twelve months’ worth of events have been compressed into it. The Iran–Israel war, the oil price shock, FII selling, a weakening rupee, earnings downgrades and then, almost as quickly, a ceasefire, a partial oil reversal, and a market that bounced before most investors had finished explaining why it should not.
A Quarter That Felt Like a Year
The tariff shock of April 2025 and the oil-war shock of early 2026 look alike on a chart with sharp FII selling, a falling rupee, an equity market in retreat. But they are structurally different in a way that matters for how you position through them.
Tariffs can be modified with a tweet. A 90-day pause, a bilateral deal, a presidential proclamation and the instrument of harm is also the instrument of resolution. The tariff shock of last year resolved in weeks, from the market point of view, because it had a protagonist who could reverse it.
Physical infrastructure destruction is different. When ships cannot pass through the Strait of Hormuz, crop sowing seasons are missed, the price of almost every input and every widget goes up, and the transmission mechanism into inflation and margins is real, broad, and slow to reverse. Brokerages have already downgraded FY27 earnings estimates and India’s GDP projections. These cuts are not just price-action-driven, they reflect the actual cost of disrupted supply chains working through the system over two to three quarters.
The ceasefire changes the trajectory, not the damage already done. Assuming the ships begin passing, without any threat, through the Strait of Hormuz by May 2026, the worst of the input cost shock is behind us. March earnings season and its commentary will give us the first real preview of what the June 2026 quarter looks like. What we do know is that markets are a discounting machine. They have already repriced the shock. The question now is whether they have priced in enough of the recovery.
This letter is not about those events. It is about something more fundamental: the kind of risk that generates all of them. We have been calling it the Orange Swan. Understanding it changes how you think about the portfolio and about every crisis that will follow this one.
For a generation of investors, the Black Swan was the ultimate bogeyman. Nassim Taleb’s framework was useful precisely because it named the fear: the bolt from nowhere that no model could anticipate, that lived outside every historical distribution, that arrived without warning and departed having changed everything. COVID was a true Black Swan. Unknown, unanticipated, and structurally transformative.
The Orange Swan
Markets do not only break on surprises. Sometimes they break on something visible and widely discussed. Something that refuses, stubbornly, to resolve, sits in every bank research note and central bank minutes and CNBC panel discussions and yet remains fundamentally unclear about what it will actually become.

We call it the Orange Swan.
- The Iranian nuclear programme
- Trump’s tariff architecture
- AI’s disruption of white-collar employment
- The restructuring of global supply chains.
These are not unknown. They are right there, in the open, being watched and debated in real time. And yet, for all their visibility, they remain fundamentally ambiguous about their magnitude, direction, and timeline. That ambiguity is not a temporary condition. It is their defining characteristic.
The Black Swan invites humility because you cannot predict it. No amount of macro and micro analysis can help you anticipate it. The Orange Swan on the other hand, tempts you to predict with conviction. It creates the illusion of control. That confidence in predicting the outcome, not the unexpected shock, is where portfolios go to die.
In cricket, Jasprit Bumrah’s yorker is an Orange Swan. Every batsman knows it is coming. They prepare for it in the nets. The analysts have charted it frame by frame. And yet it still takes wickets at the highest level, because knowing something is coming and being able to respond correctly to it are entirely different problems. The Iran–Israel war was visible for months before it escalated. The oil shock was a known risk on every portfolio manager’s list. The question was never whether it would happen, it was how bad, how long, and what came next. That is precisely what nobody could answer with confidence. That is the Orange Swan.
The Thirteenth Spike
On March 2nd and 3rd 2026, WTI Crude Oil surged +6.3% and +6.1% on consecutive days as Middle East tensions escalated. This was the 13th instance of a two-day WTI spike of 5% or more since 1990. India, which imports approximately 85% of its oil, felt immediate pressure in its currency, its import bill, and its equity market. The median Indian market return over the twelve months following an oil price shock of this magnitude: +43%. Twelve for twelve. Every prior instance in 35 years resolved into a positive annual return. This is not a large enough sample size but still gives us an indication of how things could look a year from now. We covered this in a detailed article which you can read here: What Happens to the Indian Market After Oil Spikes?
The most important question. Where Are We in the Cycle?
Our QED Value Compass dipped into green territory in March 26.
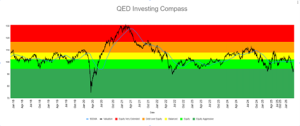
Valuation alone is intuitive but incomplete. Sentiment is the other variable that impacts markets significantly. Remember the two main emotions that drive Mr. Market – Greed and Fear. Valuations and Sentiment reflect those two emotions.
The chart below plots the Indian equity market across every significant shock since 2000. The horizontal axis measures valuation relative to historical averages. The vertical axis measures momentum as a proxy for collective market sentiment. Each event is shown as a trajectory: where the market moved to at the trough, and where the episode is completed i.e. the recovery arc. There are four quadrants.
- Stage 1 – Valuations cheap and Momentum Negative
- Stage 2 – Valuations cheap and Momentum Positive
- Stage 3 – Valuations expensive and Momentum Positive
- Stage 4 – Valuations expensive and Momentum Negative
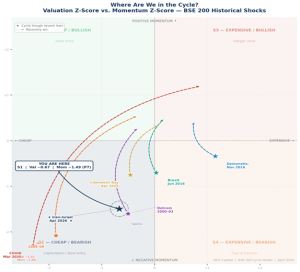
QED Capital Cycle 2×2 — Valuation vs. Momentum, Historical Market Shocks | April 2026
The pattern is consistent. GFC 2008 and COVID March 2020 drove the market deep into the bottom-left quadrant, genuinely cheap on valuation and extremely oversold on momentum simultaneously. Those were true Stage 1 capitulation events. The recoveries from those depths were the most powerful in the dataset: +126% in the twelve months after March 2009, +91% after March 2020. Very few investors actually bought at those bottoms, because the news at those moments was uniformly catastrophic.
Today’s reading is also Stage 1. As of 6 April 2026, the BSE 200 Cycle Model shows a Valuation Z-score in the 25th percentile of all historical readings, meaning the market is cheaper than three-quarters of all observations going back to 2004. The Momentum Z-score in the 7th percentile, meaning only 7% of historical trading days have ever recorded weaker momentum than this. The combination places us clearly in Stage 1. The star on the chart marks the exact coordinates. The readings have considerably improved after the bounce back once the ceasefire was announced.
STAGE 1 — the Cheap / Bearish quadrant — has delivered a median 12-month return of +19.3% in the BSE 200 Cycle Model, with a 96% hit rate across all historical episodes. The model has only ever recorded a negative 12-month outcome from this stage once.
The table below the chart shows each shock episode’s journey — the solid-star shock period and the recovery arc that followed. Brexit, Demonetisation, and Liberation Day all resolved from more moderate positions. GFC and COVID resolved from deeper ones. The Iran–Israel shock of 2026 sits between: genuine STAGE 1 on both axes, but not as extreme as 2009 or 2020. The implied forward trajectory is not a straight line. But the direction of the historical distribution is unambiguous.
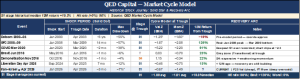
One caveat is the model does not override process and it does not aim to predict bottoms. The Stage 1 reading does not tell you the bottom is in, or that the next three months will be positive. It tells you the risk-reward over a twelve-to-twenty-four-month horizon has historically been among the most favourable in the data. That is the information that belongs in an investment decision. The rest, the daily noise about ceasefires, oil prices, and earnings revisions, is the film playing over the top of the data.
Risks and Outlook
The ceasefire removes the scenario that would have changed the India macro story materially: a sustained high-price oil environment driven by Strait of Hormuz disruption. What remains is an oil price that spiked, caused real but containable damage, and has partially reversed. It may still take some time to get to a durable agreement between Iran, Israel and US, to get ships moving and oil prices correcting back to pre-war levels.
India entered this shock in a better structural position than in prior oil episodes. Forex reserves remained ample throughout the escalation: rupee weakened but was well-defended, no emergency rate action, no repeat of 2013’s taper tantrum dynamics. The RBI was a visible participant on the other side. Pressure was proactively managed.
FII flows are the variable to watch most carefully from here. The return of FIIs in February 2026, the first sustained FII buying after more than a year of net selling was interrupted by the conflict. It was not reversed in the structural sense. The underlying case for India remains intact: corrected valuations, rate transmission beginning to work and the domestic demand thesis. The ceasefire restores the conditions for FII re-engagement. Investors who wanted a better entry in February may find that the volatility of the past weeks provided exactly that. Or attention moves back to AI and Semis.
As long as we don’t get a reliable agreement between US-Iran, that the market believes in, oil prices will remain volatile and so will equity markets especially India. Oil futures show lower prices over the next 6-9 months, but these can change if the stalemate prolongs. However, as a certain point, significant demand destruction will begin to show up which can lead to a stagflation type situation. That is not good for any asset class, even oil.
There also seems to be some concerns around the current heat wave, impact on monsoons and the cascading effect on food prices and rural sector consumption. The rupee was well defended, but its trajectory seems fairly clear. The government will have to let it find its fair value while smoothing out the volatility.
The earnings impact will show up in Q1 FY27 numbers. Input costs, logistics margins, and discretionary demand all absorbed some shock. These are one-quarter effects layered onto a multi-year recovery story. If oil stabilises near current levels, which the ceasefire makes more plausible, then the H2 FY26 recovery thesis survives. Sectors performing well before the war shock have already begun bouncing back first, which is the pattern history suggests.
Living with the Orange Swan: Temper Return Expectations and Focus on Asset Allocation.
In a world populated by Orange Swans, the investment edge will not come from being more right than the consensus. It will come from being structured in a way that does not require you to be right at all. Asset allocation becomes a defence system built on the question whether the portfolio can survive and compound through a range of scenarios not just the one your advisor/manager currently believes in.
You won’t win by being right. You need to survive by not needing to be right.
In practice, this means assuming you will be wrong on outcomes and sizing positions accordingly. It means protecting against concentrated bets built on fragile views. It means letting outcomes emerge across a range of scenarios rather than forcing a single thesis. And it means replacing reaction with rebalancing, and conviction with preparedness.
Our process is designed precisely for this. The rules-based framework does not require a forecast to function. It requires a process that has been stress-tested, a risk management layer that activates when conditions deteriorate, and the discipline to follow both when it is uncomfortable. The Iran–Israel shock was an Orange Swan. It was visible, watched, and deeply uncertain. The portfolio’s response was not to forecast its resolution, it was to manage the exposure while the resolution played out, and to remain positioned for the recovery when it came. Our results reflect that.
That is what the next Orange Swan will require too. And there will be a next one.
In March, our systems gave us exits across strategies which resulted in significant cash holdings as of March end. As per time frame and rebalance frequency that has now reversed and we have deployed steadily in April. Risk is what we can manage and we managed that in March 26 saving a fair amount of downside. This also means that we will capture only a portion of the sharp up move in April. Over a long period of time like 3-5 years, these monthly and quarterly fluctuations don’t even register on the NAV chart, unless we get a 2008 or 2020 kind of situation. The aim of these systems is to manage risk to avoid deep and long drawdowns. In a sideways market, this results in an increase in churn and the risk of looking foolish in some periods. However, that is how the system is designed. To protect capital from deep drawdowns and deliver superior risk-adjusted returns.
Performance Commentary – Annual Review
AlphaBets
A very tough year for markets, but AlphaBets ended the year in positive for the 5th year in a row now and out performance in 4 out of those 5 years. During the year ended March 31st 2026, AlphaBets delivered a return of +1.17%, outperforming the benchmark return of -3.12%. In March 26, AlphaBets returned -8.19%, outperforming the benchmark decline of -11.37%, reflecting relative resilience during a particularly weak month for broader markets.
The momentum index delivered a return of -13.7% in March 26 and -3.5% during the FY 25-26 period.
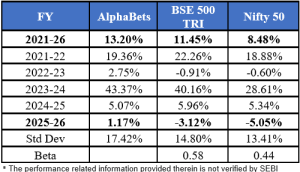
The strategy navigated a highly volatile market environment marked by shifting leadership, sharp corrections, and changing risk appetite, while preserving capital and generating positive absolute returns. All this while keeping a low beta (correlation) of 0.58 and 0.44 to the Nifty 500 and Nifty 50 respectively.
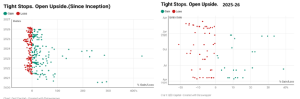
To demonstrate our process visually lets look at two scatter plots. A picture speaks a thousand words. The graphs below show this. The scatterplot on the left shows gain-loss distribution since inception. The red dots are clustered, and the green dots are widespread. This tells us that losses have been contained and that is the only part in our control. The green dots are what the market does. The chart on the right for FY 2025-26 shows that while losses have been contained, the market didn’t exhibit longer trends which is displayed by fewer green dots. Trends started and were interrupted by man-made events or abruptly reversed. However, remember the more spring coils, the bigger the move is, when this sideways period ends.
From the start of the financial year through February, market gains were led by Metals, which emerged as the strongest performing sector, alongside strong performance in Auto. Banking and Infrastructure also contributed positively, while Information Technology, Realty and FMCG remained relatively weak over the same period. Momentum conditions had also improved by February as leadership trends strengthened across select cyclical segments.
However, the sharp market correction in March led to broad-based weakness with Banking, Auto, Financial Services and Realty among the hardest hit sectors, reversing a significant portion of the gains accumulated earlier in the year.
Despite a challenging year for the momentum factor, AlphaBets delivered positive returns and outperformed the benchmark, supported by efficient stock selection, prudent risk management, and disciplined allocation toward areas of relative strength.
Core Equity
Core Equity delivered a return of -1.76% during the year, outperforming the benchmark decline of -3.12%. In March 2026, Core Equity returned -11.23%, broadly in line with the benchmark decline of -11.37%.
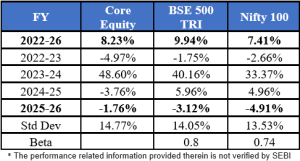
The strategy’s diversified multi-factor framework, combining value, low volatility and momentum helped navigate a mixed market environment during the year.
From the start of the financial year through February, value was the strongest performing factor by a wide margin, supported by continued strength in cyclical and economically sensitive segments of the market. Momentum conditions also improved during this period as market leadership strengthened across select sectors, while broader participation expanded. Low volatility delivered steadier returns, providing balance within the overall factor mix.
However, the sharp market correction in March led to broad based weakness across factors, with momentum and value strategies among the more affected factors as earlier leadership reversed abruptly. In contrast, more defensive and quality oriented areas of the market showed relatively better resilience during the selloff.
The portfolio’s diversified, multi-factor construction held up well over the full year, delivering outperformance despite headwinds during the abrupt March reversal.
Index Alpha
Our ETF portfolio delivered a return of +7.18% during the year, compared to the benchmark return of -3.12%. In March, Index Alpha returned -7.93%, outperforming the benchmark decline of -11.37%.
As an equity tilted, multi asset strategy, Index Alpha benefited from diversification across equities, fixed income, and gold during the year. In particular, the strong performance of gold provided an important offset to equity market weakness, helping cushion volatility and contributing meaningfully to the portfolio’s outperformance. Disciplined asset allocation and periodic rebalancing further supported superior risk adjusted outcomes over the year.
Conclusion
Stay safe and take care. Thank you for investing with us.
QED Capital Team